James Shepherd-Barron
Latest posts by James Shepherd-Barron (see all)
- HOT FROGS and the monetization of money - 3rd March 2021
- CoVid Lessons Un-Learned - 29th January 2021
- HOLE IN THE WALL (Book Extract) - 18th January 2021
At his first daily press briefing on 30 March 2020, Dominic Raab, the UK Foreign Secretary, referred assembled journalists to the “latest update from our COBRA Coronavirus Dashboard.” He then spent much of the next 40 minutes providing imprecise answers to very precise questions. Much of what he said sounded like spin, not evidence-based decision making. Speaking from behind a podium emblazoned with what is in effect a political slogan rather than a public health message, perhaps the fact that listening to random government ministers speaking to ‘core press lines’ as if voicing over a Hovis bread commercial is the best we should expect.
But one mis-spoken word, one garbled sentiment in such panicky times gives a sense that our leaders are all at sea, floundering in a rip-tide of ad-libbed condescension. And in a frightened world certain only of uncertainty, this steadily but surely erodes trust in those who purport to protect us; a situation not helped by an over-zealous Police service quite demonstrably interpreting well-meaning government guidance with their own Orwellian brand of wooden-brained, judgmental heavy-handedness. A Police state and the wholesale infringement of civil liberties it implies in an era of ‘lockdowns’ and social isolationism is not where any of us want to be, or want to go.
A lot of this is down to wooly communications. OK, in the early stages of the C-19 response the government was trying to nudge us into changing our behaviour by politely suggesting we exercise outdoors only once a day. It became clear that the public had misinterpreted this nudge and had driven in their tens of thousands to walk in Derbyshire’s Peak District, it became clear that the type of dictatorial clarity introduced early on by the French was needed. In France, an ‘attestation’ was needed before leaving the home, one of the criteria permitting such action being ‘daily exercise in the vicinity of the home.’ This clarification was later added to the UK government’s advice.
But we British pride ourselves on our libertarian laissez-fair attitude and resent being told how to behave by the state. Knowing this, and well aware that indefinite lockdowns implode through the weight of their own boredom, tension and loneliness, the government has been careful to take a nuanced approach to the way mass behaviour change is invoked. This also makes good epidemiological sense as to go into lockdown too early – or too late, for that matter – risks causing more problems than it cures.
For a country to succumb in the way the UK meekly has to dictatorial diktat involves high levels of trust in organs of the state, particularly the Prime Minister’s Office. Squander this trust and public sentiment spirals downhill extremely rapidly. We learned this lesson time and again during the Ebola epidemics in Africa over the past decade.
Credibility in an era of social media and instant communications depends on factual information clearly, consistently and coherently explained. Where facts are hard to come by, then explanations of the assumptions behind the analysis will do. The public are not easily fooled. Any sense that science has been interfered with by politics or that unpalatable truths have been dumbed down or politically spun quickly undermines the nation’s trust in the capacity and capability of its leaders. In the final analysis, anything other than clear-eyed realism and total transparency results not just in a loss of credibility, but unnecessary loss of life. This is why Governor Cuomo is doing so well in New York.
As we gird ourselves for the acceleration of this epidemic to its late-April peak, trust in government is wavering. This is largely because, as Giles Whittell of Tortoise Media put it on 30 March 2020, “Governments are generally underperforming as purveyors of reliable information on the pandemic.”
What could they do better?
In Sierra Leone, three months after the Ebola outbreak was declared and one week after a national state of emergency was announced, the national ‘Ebola Operations Centre’ established to manage the extensive control measures needed consisted of little more than two flip-charts, one without paper, and a pile of pens strewn across a dusty table. There was nothing to show that this small room, crowded with empty chairs, was an ‘operations centre’ for anything, let alone an unfolding national calamity. There were no maps and no organigrams on the wall to show who was responsible for doing what, where, and when. There were no graphics charting the progress of the disease or of the measures underway to control it.
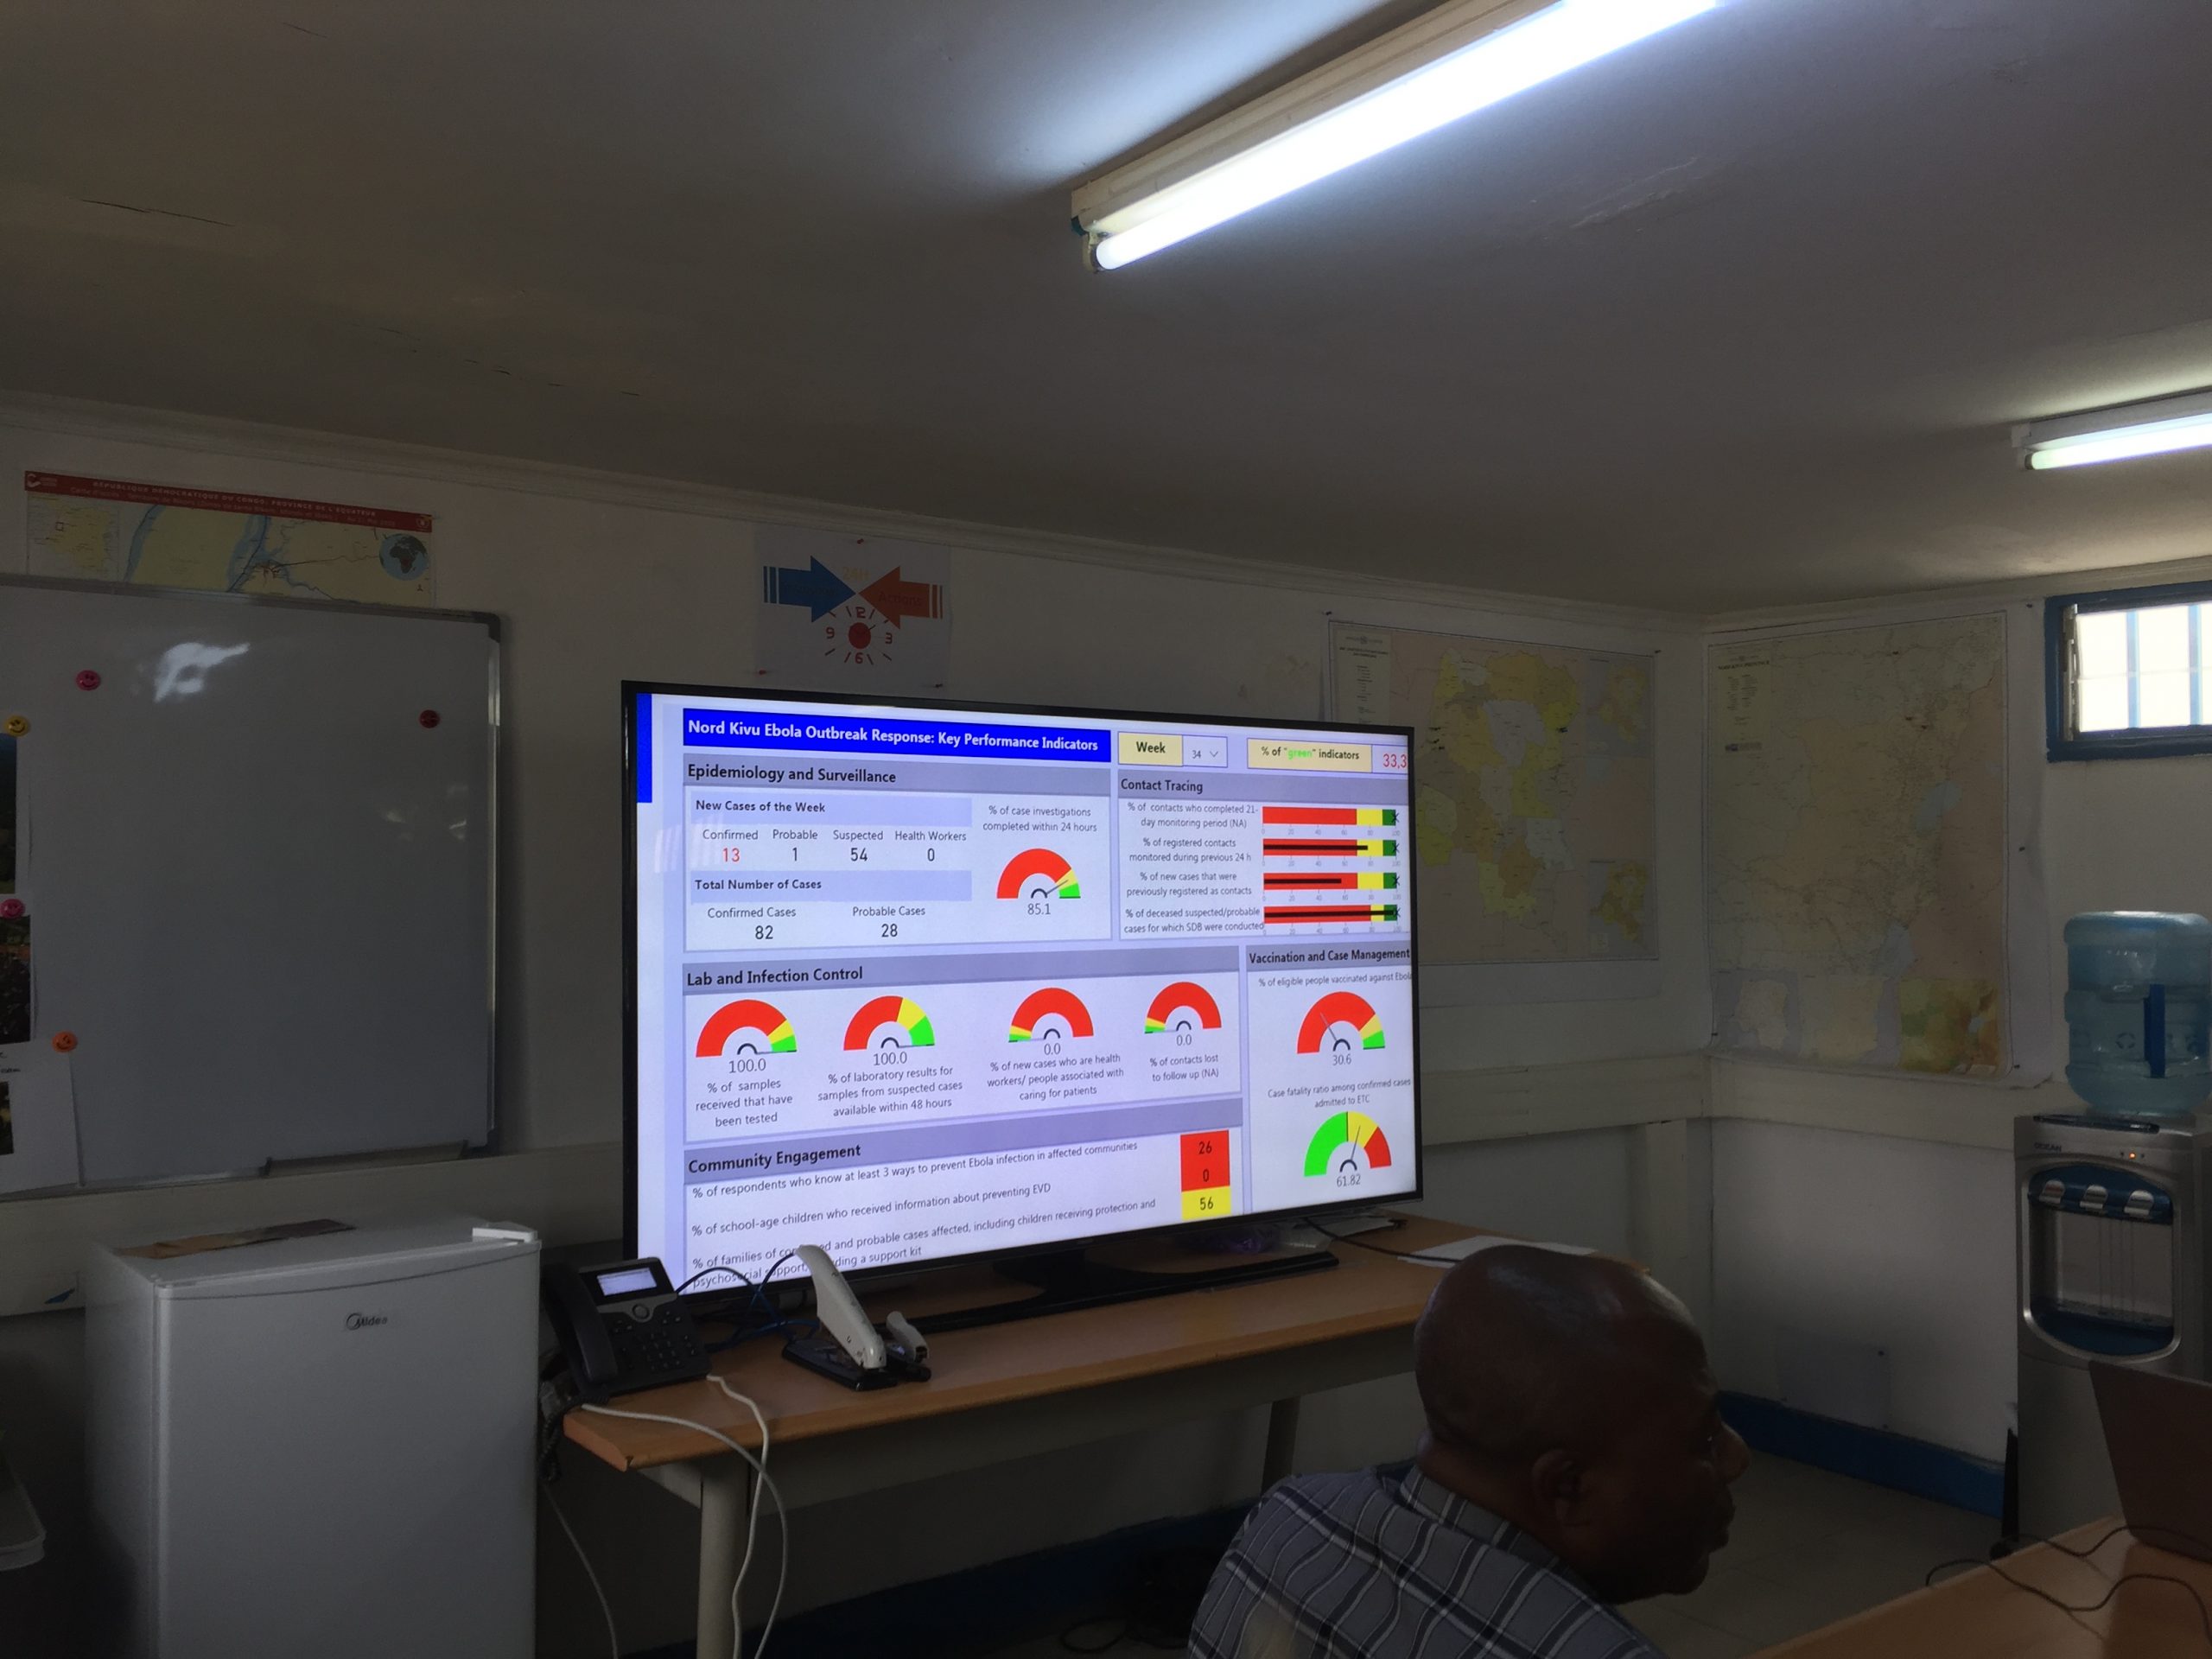
The World Health Organization has come a long way since then and by the time of the 2018 outbreaks in DRC had designed an operational template for enhanced coordination and control, including on how to report on what they call KPI’s or Key Performance Indicators. As with the COBRA C-19 Secretariat in London, the Emergency Operations Centre in Kinshasa would gather data from the affected area and from all over the world, compile it into 13 response areas (each with specialist ministry committees), interrogate the data, make their collective analysis, and report their findings to the Minister of Health at 2 pm every day. Rarely did anybody agree on anything. Heated discussions between doctors, epidemiologists, statisticians, logisticians and bureaucrats, both in the room and down the line from all over the world, would ebb and flow in this seething cauldron all morning, ending up as one coherent, easily readable dashboard in time to brief the minister who, one hour later, would brief the world.
Such a ‘management system’ exists. What it should look like is outlined in the ‘World Health Organization Framework for a Public Health Operations Centre’. Produced on the back of lessons learned from countless outbreaks around the world over decades, it has been designed by information managers who know how to present qualitative and quantitative data in easily understandable form. It does not need to be re-invented. It includes data on what UN disaster managers call “4W (who, what, where, and when) mapping” combined with health information management data on aspects such as hospital capacity, bed occupancy, laboratory diagnostics, case management, contact tracing, disease surveillance, supply chain management and human resourcing. Lots of numbers are then transformed into easy-to-understand graphics and supplemented with time-lapse maps to create a single gateway into what is going on in real time. The World Health Organization’s dashboard covers one entire wall of its Emergency Operations Centre in Geneva.
Tracking operational outcomes against KPIs, together with an explanation of what is being done to address shortcomings, is useful for both downstream operational planning and upstream accountability and is a standard operating procedure in international disaster responses, as is regular gap analysis. Reflecting operational performance against pre-determined criteria and benchmarks is critical, not just for strategic oversight and programme adjustment but for better integrating risk communication and community engagement into the overall response … a frequent shortcoming in outbreak responses up until now.
If the British government is using such a dashboard – and it is – then all it has to do is show it to the world, warts and all. When numbers are noisy and the data flaky, all the specialists and the politicians have to do is explain the assumptions behind why they have made the decisions they have. Every sentence is vital; every word critical. There is no room for mis-speaking in such a febrile atmosphere.
Providing such clarity in all its gory detail might confuse – or even upset – some of the public some of the time, but it would stop the media filling in the gaps with its own muddled and simplistic interpretation, much of it designed for effect rather than information. This is why, for example, we consistently hear about ‘how many people died yesterday’ rather than how many died as a percentage of the laboratory-confirmed caseload or whether the rate at which these deaths occurred is accelerating or decelerating, or is above or below that which was expected. Key statistics such as Case Fatality Ratios and explanations on why ‘mortality rates’ are different are not presented at all.
With a dashboard we could see the evidence for ourselves and draw our own conclusions. We could see when the government expects transmission or mortality to peak and when herd immunity might be achieved. From this panoply of graphs and graphics we can deduce our own patterns and work out for ourselves how to plan our lives in the new normal of limbo, lack of livelihood, and lockdown. We neither need nor want to be patronised. We just demand to be informed.
© James Shepherd-Barron
31 March 2020